
7 - Electronic devices and appliances
7.3. Quality and reliability
Quallity and reliability
Quality: the achievment of electrical and physical conformance to an inspection specification.
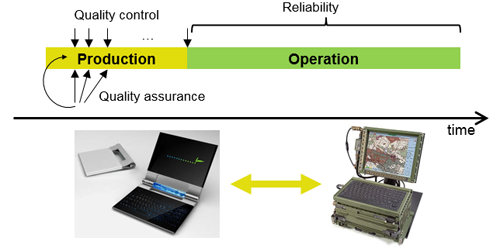
Reliability: the ability of a component to perform a given function under stated conditions for the desired duration.
Quallity assurance in production before the deliver of the product
Quality inspection – failure detection:
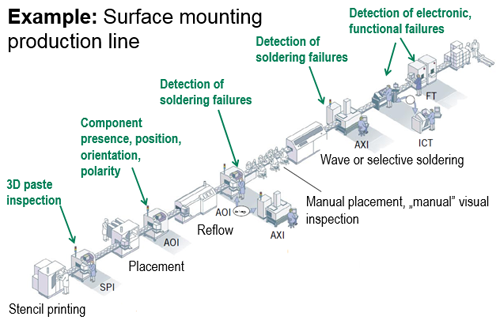
- visual control
- AOI – Automatic Optical Inspection
- AXI – Automatic X-ray Inspection
- ICT – In-Circuit Test – electrical test
- FT – Functional Test – testing in operation
- Load tests: performed under extreme conditions (temperature, humidity, mechanical vibration, etc.)
AOI – Automated Opical Inspectio
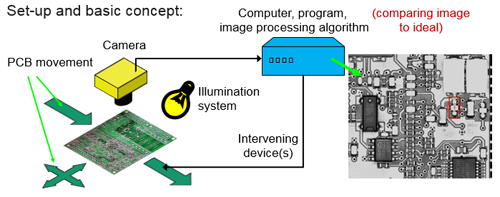
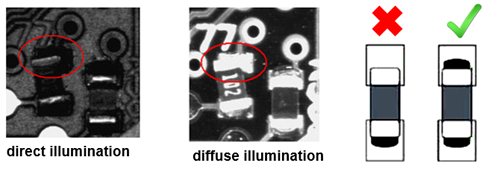
This is one of the most common inspection methods, because it is automated (economical), non-contact (no risk of ESD), flexible (AOI can be programmed), fast (in-line), most of the physical failures can be detected this way.
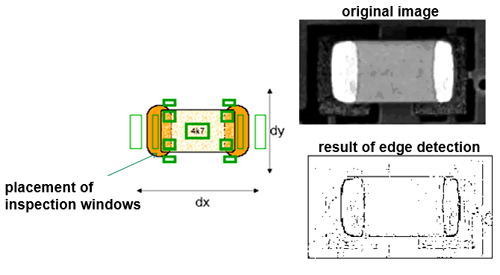
Failures detectable by AOI (examples): misplacement (Δx, Δy), skew, polarity, mechanical damage, quality of paste printing, open joint, short.
In case of adequate illumination, the concave fillet of a good solder joint scatters light, so it appears darker. If there is no joint, the flat surface of the pad appears bright in the image.
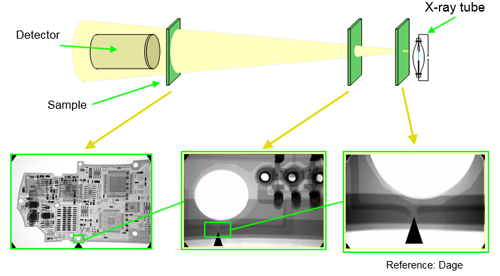
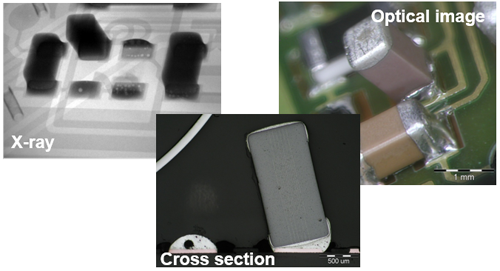
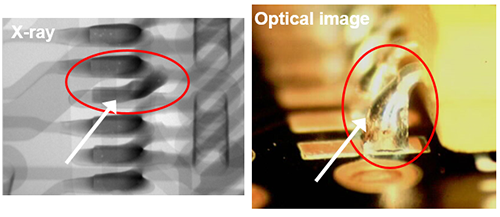
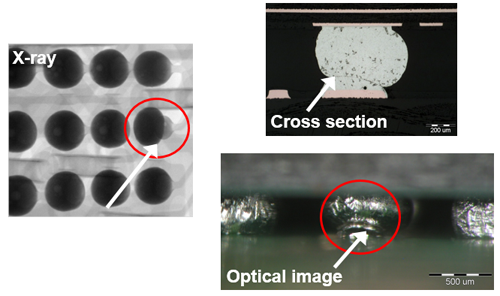
AXI – AutomatED X-Ray Inspection
Possibility to inspect hidden joints (area array packages, cooling plates) and small solder joints (fine-pitch QFP).
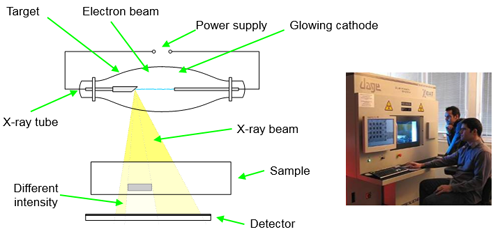
The magnification can be varied by the position of the sample:
ICT – In-Circuit Test
What can be measured by ICT: resistance, capacitance, inductivity, polarity, detection of open joints, detecting opens and shorts in PCBs, (next test step: functional test - FT)
Advantage: measures electrical parameters, can substitute AXI.
Disadvantage: elatively long measurement time, contact measurement (risk of mechanical damage)
Construction: fixture
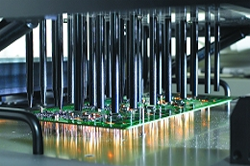
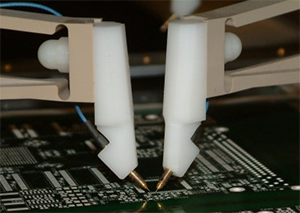
an flying probe.
Aim of standard founder organisations: matching the interests of the manufacturers and users, coordinate the diverse technical and developmental needs. The most important concerning standards: IPC-A-610: Acceptability of electronic assemblies, IPC-A-600: Acceptability of printed boards, IPC-TM-650: Test methods (free!), J-STD-001-006: Soldering and solderability standards, J-STD-035: Acoustic microscopy, J-STD22-….: Accelerated life-time tests, IPC-7711 and 7721: Repair and rework.
IPC-A-610 acceptability of electronic assemblies. Classification according to the applications:
Class 1 – General electronic products (consumer)
Class 2 – Dedicated service electronic products (continuous operation is desired, but not critical)
Class 3 – High performance electronic products (continuous high performance if critical, e.g. medical, safety, automotive)
Levels of acceptance: Target condition – close to perfect, acceptable condition, defect condition or process indicator condition.
Refloe soldering Failuers
Tombstone: This type of failure occurs in the case of chip components, when one of the terminals is lifted from the pad. The cause of the failure is the different wettability or different time of wetting of the two terminals and/or pads.
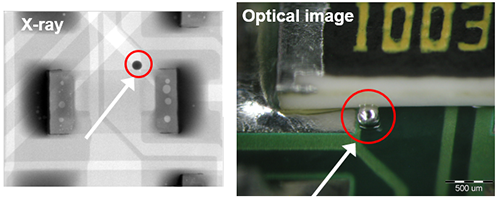
Mid-chip balling: Solder paste gets under the component and during reflow it forms a ball and appears at the side.
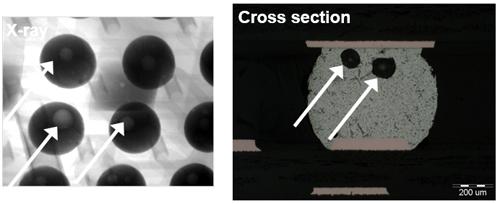
Voiding: gases can not leave the molten solder. It can be caused by flux residues (vapour) and gas evaporation out of through holes of the PCB. This results in cavities on the surface and/or voids inside the joints, which can decrease the mechanical strength of the joints.
Solder wicking up: Part or whole of the solder material is wicking-up on the lead. Appears in the case of gull-wing and J leads.
Head in pillow: Both the bump and the solder paste is molten during the reflow process, but they are not mixed, no solder joint (no electrical and mechanical joint) is formed.
Desgin for reliability
Design for reliability helps in planning (predicting) the probability of reliable operation of components, products, systems in time under given circumstances.
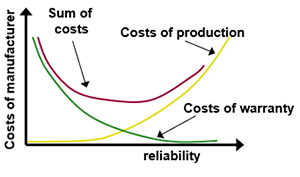
Advantage of design for reliability: the optimum of product reliability can be found (costs of the manufacturer are taken into consideration), time of preventive maintenance can be planned (in case of critical systems), the life-cycle of the products can be planned (early failures, obsolence), level of redundancy can be designed in case of critical systems, the reliability of the components building up the product can be harmonized.
Indicators of the reliability
Basic test: let’s operate similar components under the same conditions and register their time of failure:
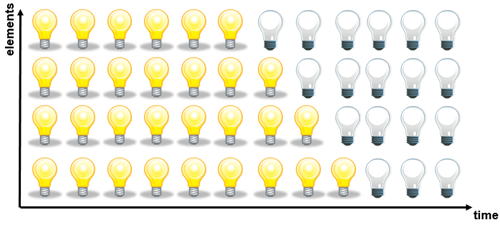
Reliabilty can not be described simply by the length of its life-time, since it differs for every part. Tools of statistics and probability calculations have to be used.
Properties of the reliability function:
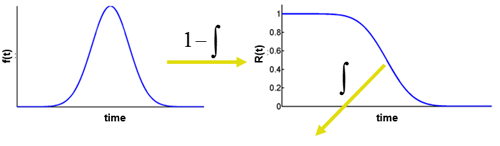
- starts from 1 (at time=0 every component functions properly)
- approximates to 0 (sooner or later every component will fail)
- continuously decreasing (components wear out)
- mean time to failure (average expected life-time) can be calculated by integrating it in the whole time interval (T0, MTTF, Mean Time To Failure)
Summarize the time of failures (tua) on a histogram:
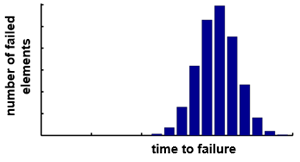
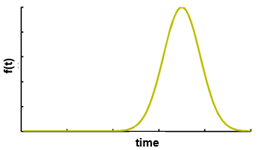
In case of infinite number of components this gives a continuous function, its integral can be normalized to 1, this is called the probability density function (f(t)).
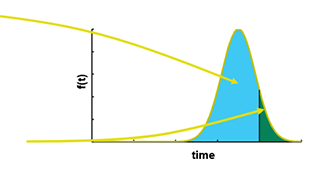
What can the probability density function tell us: tells the probability of a certain functioning time interval and the probability of a failure occuring in a given time interval:
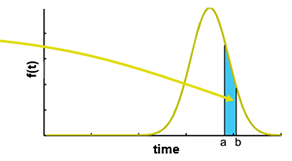
The probability of a failure occuring until a given time point (failure function, F(t)) and the probability of reliable operation until a given time point (reliability function, R(t)):
The most important question of reliability: how often can we expect a component or device to fail during operation? The failure rate function can give answer to this question: in a given component population the number of failures divided by the sum of time until the failure (or end of test). Failure rate function:
Failure rate function
The reliabilty of a component (failure rate function) depends highly on the circumstances of operation and the design of the component. In the case of electronic components the most important "certain" factors are: design type (commercial, industrial, military…), production technology (eg. small and high resistance resistors are different), temperature, load.
"Uncertain" factors are the operation circumstances of the device: temperature and its fluctuations, humidity and its fluctuation, vibrations, shocks (e.g. desktop, mobile, automotive), other factors (e.g. corrosive environment)
How to define the failure rate function: modelling the components (limited possibilities due to the complexity of components), experimental methods are based on standards (eg. Mil-HDBK 217F) are based on own experiments and their evaluation.
Types of failure rate functions
The failure mechanisms of different types of components are not the same, so is the reliability density function over time. The groups are differentiated according to „shape” of their reliability density function f(t).
Normal (Gaussian) failure rate function:
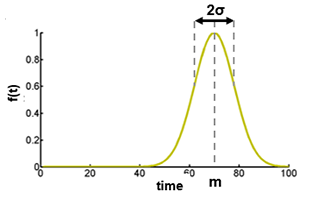
The failure mechanism is dominant, when the component is functioning; λ(t) grows monotonously over time (continuous ageing), description:
where m is the expected life time, MTTF and sigma is the deviation (uncertainity).
Examples: light bulb, relay, switch, potentiometer.
Exponential failure rate function:
The failure mechanism is not significantly influenced by the operation time, λ(t) is constant over time, λ(t) => λ (the component is not ageing). Because of the simplicity of the mathematical description, this model is widely used (standards often approach all the components with this description). Description:
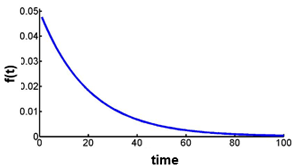
Examples: resistor, transistor, integrated circuit.
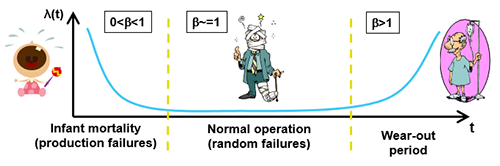
Weibull failure rate function:
Able to describe complex systems, where, at the beginning, early (built-in) failures can appear (infant mortality); towards the end of life-time, wear out-type failures can occur, the „bathtub” curve (λ(t)) is decreasing at the beginning, then it is constant, later it is growing. Description:
Failures arising during operation
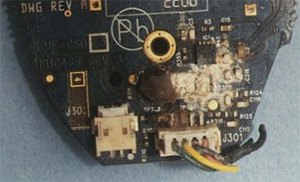
Corrosion: Starting from surfaces, chemical, electrochemical processes induce degradation of metallic parts
Fatigue/overload crack: Thermal cycles and/or vibration can cause fatigue cracks, while a sudden impact can lead to an overload crack
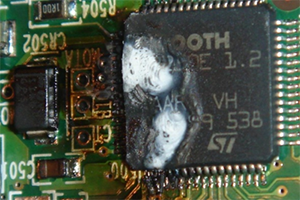
ESD/EOS (Electrostatic Discharge/Electric Overstress): The failure is induced by the thermal effect coused by the discharge.
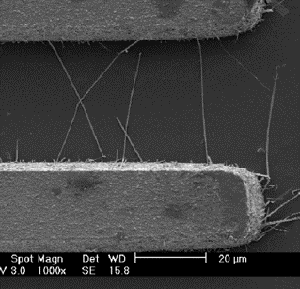
Whisker: Needle like single crystals growing out of metal can lead to shorts
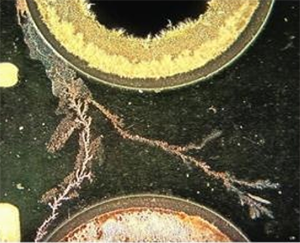
Dendrite: Shorts formed between electrodes due to metal deposition caused by electrochemical migration process.
| Previous | Next |